Normal A1C Levels By Age And Why They Differ
Search for normal A1C levels by age and you will find tables that assign a different acceptable figure to every decade of life. Those tables mix up two separate ideas, and the confusion they create is worth untangling, because it changes how you should read your own result.
The screening scale does not move with age
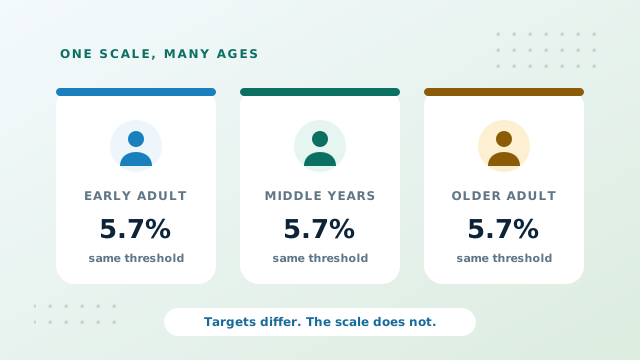
The thresholds used for adult screening, 5.7 and 6.5 percent, are the same whether you are twenty five or eighty five. There is no official chart that raises the diagnostic line as birthdays accumulate. A result of 6.6 percent means the same thing on the report in both cases.
What does change with age is the target a clinician might agree with someone already diagnosed. That is a different question with a different answer, and it is where nearly every age based table on the internet actually comes from.
Two questions, easily confused. Where does this result sit on the screening scale? Age does not affect the answer. What should this person be aiming for? Age affects the answer a great deal.
Why average results drift upward anyway
Population studies consistently find that average A1C values are slightly higher in older age groups. Several mechanisms contribute, and none of them involves the reference scale being redrawn.
- Insulin sensitivity tends to decline gradually. The same meal produces a slightly higher and slightly longer glucose response than it did decades earlier.
- Body composition shifts. Muscle mass typically falls and fat mass rises, and muscle is where a great deal of glucose is taken up after eating.
- Red blood cell turnover slows modestly. Cells that survive a little longer accumulate a little more glucose coating, nudging the measured percentage upward independently of glucose itself.
- Other conditions and medications accumulate. Kidney function, anemia and several common prescriptions all touch the result in one direction or another.
So a drift upward across decades is expected at population level. It is a description of what tends to happen, not permission for any individual reading to be re-labelled.
How targets actually loosen with age
For somebody already managing diagnosed diabetes, guidance is deliberately flexible. A tight target carries a cost, and that cost falls unevenly across a lifetime. The table below shows the shape of the reasoning rather than a prescription for anyone.
| Stage of life | What tighter control buys | What it costs |
|---|---|---|
| Younger adult, few other conditions | Decades of reduced complication risk | Usually worth it |
| Middle years, some conditions | Meaningful long term protection | Balanced case by case |
| Older adult, otherwise well | Still real, over a shorter horizon | Weighed against hypo risk |
| Older adult, frailty or several conditions | Limited within remaining horizon | Hypoglycemia becomes the bigger danger |
The critical factor in that last row is hypoglycemia. A low glucose episode in an older person carries a much higher chance of a fall, a fracture, confusion or a hospital admission. Pushing an A1C down towards 6.5 with medication that can cause lows may therefore create more harm than the number prevents. A looser target of 7.5 or 8.0 percent is a considered clinical decision, not a lowering of standards.
Our guide to A1C target goals goes through how these conversations are usually structured.
What an age based table cannot capture
Age is a crude proxy for the things that actually matter. Two people born in the same year can sit at opposite ends of every relevant variable.
- How long the condition has been present. Twenty years of diabetes at fifty carries different considerations to a diagnosis last month at seventy.
- Which medications are involved. Some carry essentially no risk of causing a low. Others carry a real one, and that changes how far it is sensible to push.
- Kidney and heart health. Both influence targets more strongly than the birth year does.
- Life circumstances. Someone living alone, or driving for work, weighs the risk of a low differently.
This is why no responsible source publishes a definitive normal A1C by age chart. The honest version of that table would need a column for each of the factors above.
Reading your own result at any age
The practical approach is the same whatever decade you are in. Place the result on the screening scale, convert it so the units make sense, then compare it against your own previous readings rather than against a stranger's age group.
| Result | eAG mg/dL | If screening | If already diagnosed |
|---|---|---|---|
| 5.4% | 108 | Below the band | Possibly tighter than needed |
| 6.1% | 128 | Prediabetes band | Comfortably inside most targets |
| 7.2% | 160 | Above the threshold | At or near many agreed targets |
| 8.4% | 194 | Above the threshold | Usually prompts a review |
The calculator produces those conversions instantly, and the history mode plots your own results so the comparison is against yourself over time. That is the comparison that carries information. Our guide to building a trend covers the mechanics.
Children and teenagers are a separate case
Younger people are not simply smaller adults for this purpose. Growth, puberty and school routines all affect glucose in ways that adult guidance does not anticipate, and targets are set by a specialist team. Our guide on A1C in children and teenagers covers what differs.
Pregnancy is a separate case too
Blood volume and cell turnover both change substantially, pulling an A1C below what daily glucose would suggest. See our guide to A1C during pregnancy.
Conclusion: Normal A1C Levels By Age
The screening scale is the same at every adult age. What loosens with age is the personal target agreed for somebody already diagnosed, and that loosening exists mainly because hypoglycemia becomes more dangerous as the years accumulate. Average results do drift upward across decades, but that describes a population rather than reclassifying anybody's report.
Convert your result, note the date, and compare it against your own history rather than an age table.