A1C Target Goals And How They Are Chosen
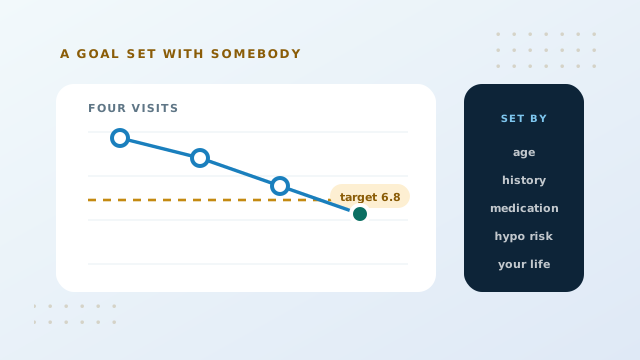
A target is not the same thing as a threshold. A threshold is where a screening scale draws a line for everybody. A target is a figure agreed between one person and their clinician, chosen for that person's circumstances, and it can sit anywhere from below 6.5 to above 8.0 depending on the reasoning behind it.
Why 7.0 percent is quoted so often
The figure of 7.0 percent appears everywhere because major trials found that keeping average glucose near that level substantially reduced the risk of eye, kidney and nerve complications over years. It became the default reference point in guidance and stayed there.
What often gets lost is that later trials complicated the picture. Pushing much lower using medications that can cause hypoglycemia did not always improve outcomes, and in some groups it made them worse. The conclusion drawn from that body of work was not a new universal number but a shift towards individualisation.
7.0 percent converts to an estimated average glucose of about 154 mg/dL, or 8.6 mmol/L. Seeing a target in those units often makes it feel more concrete than the percentage does. The calculator converts any target you are working towards.
What actually shapes an individual target
The conversation usually weighs a handful of factors, and most of them are about the cost of getting there rather than the benefit of arriving.
| Factor | Pushes tighter | Pushes looser |
|---|---|---|
| Life expectancy and horizon | Long | Limited |
| Duration of diabetes | Recently diagnosed | Many years established |
| Risk of hypoglycemia from treatment | Low or none | Significant |
| Awareness of low glucose episodes | Intact | Reduced |
| Existing complications | None | Advanced |
| Other conditions | Few | Several |
| Support and resources available | Good | Limited |
Hypoglycemia is the factor that does most of the work. Some treatments cannot cause a low at all, which makes aiming lower relatively cheap. Others can, and for somebody who lives alone, drives for a living, or no longer feels a low coming on, that risk may outweigh the long term benefit of a smaller number.
Common target bands and their reasoning
| Target | eAG mg/dL | eAG mmol/L | Typical reasoning |
|---|---|---|---|
| Below 6.5% | Under 140 | Under 7.8 | Newly diagnosed, low hypo risk |
| Below 7.0% | Under 154 | Under 8.6 | The common default |
| Below 7.5% | Under 169 | Under 9.4 | Some hypo risk or complexity |
| Below 8.0% | Under 183 | Under 10.2 | Multiple conditions, limited horizon |
| Above 8.0% | Above 183 | Above 10.2 | Frailty, safety first |
None of these rows is a recommendation for anyone reading this page. They exist to show that a looser target is a deliberate clinical judgement rather than a failure, which is a distinction people are rarely told clearly enough.
Tracking progress towards a target
Once a target exists, the useful question stops being what does this number mean and becomes how far am I from the line and which way am I moving.
The history mode of the calculator lets you draw your target as a dashed reference line straight across the chart, so every plotted result is read against it rather than against a generic reference band. That single line changes how a chart reads.
- Judge distance, not just position. A result of 7.4 against a target of 7.5 is a different situation to the same result against a target of 6.5.
- Judge direction across visits. Three consecutive moves towards the line matter more than any single step, however large.
- Expect the approach to slow. Early progress is usually the fastest. The last few tenths are typically the hardest, which is normal rather than a sign of failure.
- Record what changed and when. A note beside a result is what makes a future chart interpretable.
Our guide on building a trend chart covers the mechanics, and what actually lowers an A1C covers realistic timescales for movement.
When a target should be revisited
Targets are not permanent. Several ordinary events are good reasons to reopen the conversation.
- A change of treatment, particularly one that alters hypoglycemia risk in either direction.
- A low glucose episode, especially one you did not feel coming.
- A new diagnosis, a change in kidney function, or a hospital admission.
- Pregnancy or planning one, which shifts everything. See A1C during pregnancy.
- Reaching the target and holding it comfortably for a year.
- Repeatedly missing it, where the honest answer may be that the target was never achievable with the resources available.
That last point deserves saying plainly. A target that is never met produces discouragement rather than progress. Renegotiating it is a legitimate outcome of a review, not a concession.
If you use a sensor, a target for time in range often sits alongside the A1C target and responds far faster. Our guide on time in range explains how the two fit together.
Conclusion: Setting An A1C Target
A target is personal where a threshold is universal. The figure of 7.0 percent is a common default rather than a rule, and the main thing pushing a target looser is the risk of hypoglycemia rather than any lowering of expectations. Convert whatever target you agree into glucose units so it feels concrete, then judge each result by its distance from that line and the direction it is travelling.
Add your target to the chart and every future reading will be plotted against it.