How To Lower A1C: What Actually Moves It
This page explains the mechanics of how an A1C responds to change. It is not a treatment plan, and nothing here should be used to alter medication, which is a decision for the clinician who prescribed it. What follows is the general reasoning behind why some changes move the number and others do not.
The only thing an A1C responds to
An A1C measures the glucose coating accumulated by circulating red blood cells. The only way to lower it is to lower the average glucose those cells are travelling through, sustained across enough time for the cell population to turn over.
That single sentence rules out a great deal. Nothing taken the week before a test can strip coating off existing cells. Nothing can accelerate the replacement of the cells already carrying it. The number moves when the bloodstream those cells live in genuinely changes, and it moves at the speed biology allows.
How long a change takes to appear
| Time since the change | Visible in daily glucose | Visible in an A1C |
|---|---|---|
| A few days | Clearly | Not at all |
| Two to three weeks | Clearly | Barely |
| Six weeks | Clearly | Partially |
| Three months | Clearly | Substantially |
| Six months | Clearly | Fully |
This is why daily readings and the laboratory test are complementary rather than competing. Glucose readings tell you within days whether something is working. The A1C confirms months later whether it held. Our guide on testing frequency explains why retesting sooner than three months rarely reveals anything.
The corollary is that cramming fails. A careful fortnight before a blood draw sits inside the most heavily weighted month, but it is only half of that month, which is itself only part of a three month average. The effect is a rounding error. Our guide on test preparation covers this.
What the evidence generally supports
Broad categories rather than prescriptions, because what suits one person's body, budget, schedule and medication will not suit another's.
Movement, particularly after eating
Muscle takes up glucose during and after activity, and it does so partly through a route that does not require insulin. Activity in the hour or two following a meal therefore blunts the rise that contributes most to a raised average. Modest and regular tends to beat occasional and intense, largely because it is repeatable.
The pattern of what you eat
The A1C responds to the height and duration of glucose rises across a whole day, so the changes that matter are the ones affecting most meals rather than the occasional one. Composition, portion size and the order things are eaten all influence the curve. This is territory where a dietitian is worth far more than an article.
Sleep, sustained over months
Chronically short or fragmented sleep is associated with reduced insulin sensitivity. One bad night does nothing to an A1C. A year of five hour nights is a different matter.
Weight, where it is relevant
For many people with type 2 diabetes, a modest sustained reduction in body weight improves insulin sensitivity measurably. The word sustained is carrying the weight in that sentence, and this is not universally applicable.
Taking prescribed treatment as intended
Unspectacular, and frequently the largest single factor. Missed doses show up in an average. If something about a regimen makes it hard to follow, that is a conversation with a prescriber rather than a personal failing.
Why lower is not always better
There is a floor to how far a number should be pushed, and it is set by hypoglycemia rather than ambition. Some treatments cannot cause a low. Others can, and driving an average down with those carries real risk, particularly for older adults or anyone who no longer feels a low coming on.
A low A1C achieved through frequent hypoglycemic episodes is not good control. It is instability that averages well, and our guides on low A1C results and time in range explain how that pattern hides inside a reassuring percentage.
- Never adjust a prescribed dose to chase a number. The number is a measurement, not an instruction.
- Report lows, including mild ones. They change what a sensible target looks like.
- Discuss any large planned change beforehand. A substantial shift in eating or activity can alter medication requirements.
- Ask what rate of change is being aimed for. Gradual is usually intended, and very rapid falls occasionally cause their own problems.
Measuring whether it worked
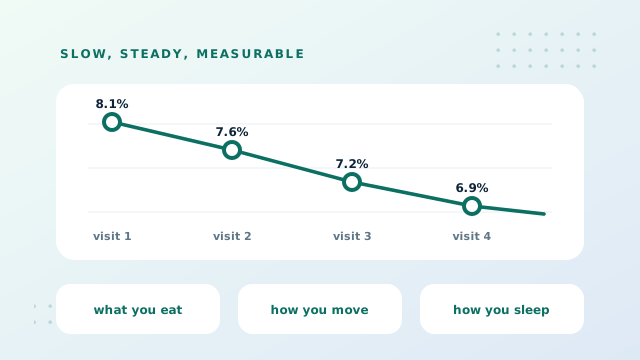
Movement in an A1C is only interpretable against a record. One result before a change and one result three months later is the minimum, and both need their collection dates attached.
| Change | In average glucose | Interpretation |
|---|---|---|
| 0.1 to 0.2 points | 3 to 6 mg/dL | Within normal variation |
| 0.3 to 0.5 points | 9 to 14 mg/dL | A real move, worth confirming |
| 0.6 to 1.0 points | 17 to 29 mg/dL | A substantial change |
| Same direction three times | — | The signal that matters most |
Entering dated results into the history mode of the calculator produces that comparison automatically, including the change in percentage points between consecutive readings. Adding a note about what changed and when turns the chart into something you can actually reason from a year later. Our guide on building a trend chart covers the habits that keep such a record honest.
Conclusion: Lowering An A1C
The number falls when average glucose falls and stays fallen long enough for red blood cells to turn over. Expect three months before a change is substantially visible and six before it is fully reflected. Movement, eating patterns, sleep, weight where relevant, and taking treatment as prescribed are the levers with evidence behind them. Speed is not the goal, and a low number bought with frequent hypoglycemia is not a good result.
Record a baseline today so the next result has something honest to be measured against.