A1C vs Fasting Blood Glucose Test
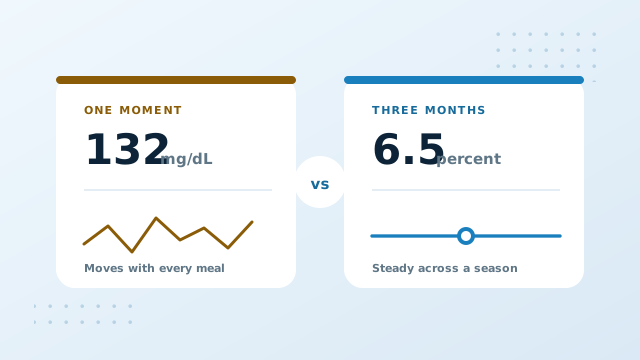
These two tests are often presented as rivals, as though a clinic picks one and discards the other. They are better understood as two different questions asked of the same bloodstream. One asks where glucose sits at a particular moment. The other asks where it has been sitting on average for months. Both answers are useful, and neither replaces the other.
What each test actually measures
| Feature | Fasting glucose | A1C |
|---|---|---|
| Window described | One moment | About three months |
| Fasting required | Yes, usually 8 hours | No |
| Affected by yesterday | Strongly | Barely |
| Affected by illness or stress on the day | Yes | No |
| Affected by red blood cell lifespan | No | Yes |
| Typical screening threshold | 126 mg/dL / 7.0 mmol/L | 6.5% |
| Raised but below threshold | 100 to 125 mg/dL | 5.7% to 6.4% |
Notice the two rows in the middle. Each test is vulnerable to something the other ignores entirely. A fasting glucose can be pushed up by a bad night, an infection or a stressful morning. An A1C is untouched by all three, but can be pulled off course by anemia or a shortened red cell lifespan. Running both means each covers the other's blind spot.
A fasting glucose threshold of 126 mg/dL and an A1C threshold of 6.5 percent are not translations of one another. 6.5 percent converts to an average glucose of about 140 mg/dL across all hours, which is a different quantity to a single fasting value.
Why the two can disagree
Discordant results are common enough that clinicians expect them. There are four usual explanations.
The shape of your day
Somebody whose glucose sits comfortably overnight but rises steeply after meals can produce a normal fasting value alongside a raised A1C. The average includes the hours the fasting test never sees. The reverse also happens, particularly where the dawn rise is pronounced but the rest of the day is steady.
Something shifting the A1C
Anemia, recent blood loss, pregnancy, kidney conditions and hemoglobin variants all move the percentage away from what glucose alone would predict. Our guide on factors affecting A1C covers each mechanism, and this is the first thing to consider when the two tests point in different directions.
Something distorting the glucose
An incomplete fast, an acute illness, a short night or a course of steroids can all lift a single morning reading well above its usual level. One fasting value is one data point, and data points wobble.
Ordinary test variation
Both assays carry a margin. Two results either side of a threshold may be describing the same underlying state.
How they are used together
In practice, a screening pathway rarely rests on one number from one visit. The usual pattern looks like this.
- An initial test. Either test can start the process, and the choice often comes down to convenience, since the A1C needs no fasting.
- Confirmation. An abnormal result is normally repeated, either the same test again or the other one, before anything is concluded.
- Reconciliation if they disagree. Where the two point different ways, the reason is investigated rather than one being picked as the winner.
- A tolerance test if the picture stays unclear. The oral glucose tolerance test measures the response to a fixed glucose load, which exposes the after eating pattern neither of the other tests captures directly.
Comparing them in your own record
If you have both figures on the same report, converting the A1C into an estimated average glucose puts them in the same units and makes the comparison legible. It will not make them equal, and it should not.
| A1C | Converts to eAG | Fasting glucose | Reading of the pair |
|---|---|---|---|
| 6.6% | 143 mg/dL | 132 mg/dL | Broadly consistent |
| 6.6% | 143 mg/dL | 95 mg/dL | After meal rises, or a skewing factor |
| 5.4% | 108 mg/dL | 134 mg/dL | Worth investigating the A1C |
The calculator produces that eAG column for you, and our guide to estimated average glucose explains how far the comparison can fairly be pushed.
Where continuous monitoring fits
A sensor answers the question both tests dance around, which is what your glucose does across a whole day rather than at one instant or on average. Our guides on time in range and the glucose management indicator cover what that adds.
Conclusion: A1C vs Fasting Glucose
One test photographs a moment, the other exposes a season. Each is blind to what the other captures, which is precisely why both exist. Disagreement between them is informative rather than embarrassing, and usually points to either the shape of your days or something affecting the measurement itself.
Convert your A1C into average glucose so both numbers on your report sit in the same language.