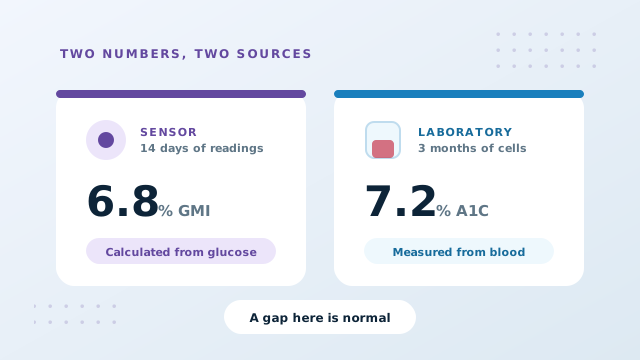
Glucose Management Indicator Versus A1C
Open a continuous sensor report and you will usually find a figure labelled GMI, expressed as a percentage and looking very much like an A1C. It is not one. Understanding what the glucose management indicator actually is prevents a great deal of unnecessary alarm when the two numbers disagree, which they frequently do.
What GMI is
The glucose management indicator takes the average glucose your sensor recorded over a period, usually fourteen days, and estimates what an A1C would be if the relationship between average glucose and glycation behaved exactly as it does for the average person.
It replaced an older label, estimated A1C, precisely because that name implied more than the figure could deliver. The word estimated was doing too little work. People read the number as a prediction of their laboratory result and were understandably confused when the laboratory disagreed.
GMI in percent is roughly 3.31 plus 0.02392 multiplied by the mean sensor glucose in mg/dL. A fourteen day average of 154 mg/dL produces a GMI of about 7.0 percent.
How it differs from an A1C
| Feature | GMI | A1C |
|---|---|---|
| Source | Sensor glucose readings | A blood sample |
| What it is | A calculation | A measurement |
| Period covered | Usually 14 days | About 3 months |
| Depends on cell lifespan | No | Yes |
| Depends on sensor accuracy | Yes | No |
| Depends on wear time | Yes | No |
| Used for diagnosis | No | Yes |
The two rows about dependency explain most disagreements. An A1C can be pushed around by anything that changes red blood cell survival. A GMI cannot, because no cells are involved. Conversely a GMI can be distorted by a sensor running slightly high, or by fourteen days that were not representative, and an A1C cannot.
Why the two numbers disagree
A difference of a few tenths between GMI and a laboratory A1C is entirely ordinary. Studies of people wearing sensors found that a substantial proportion had gaps of more than half a percentage point in one direction or the other, and gaps approaching a full point were not rare.
- Different windows. Fourteen days against three months. If the last fortnight was calmer or rougher than the quarter, the two figures should differ.
- Individual glycation rate. Some people's hemoglobin picks up glucose faster than the population average, some slower. The GMI formula assumes the average.
- Red cell lifespan. Longer surviving cells raise the A1C without changing anything a sensor sees. Faster turnover lowers it.
- Sensor bias and gaps. A period with the sensor off, or a device reading consistently high, shifts the calculated average.
- Incomplete data. A GMI built on a few days of wear is far less trustworthy than one built on a full fortnight. Most reports state the wear percentage; it is worth reading.
A consistent gap is information, not an error
If your GMI sits reliably below your laboratory A1C across several tests, that is a meaningful and stable pattern rather than a mistake by either instrument. It tells you something about your own glycation and cell biology, and once known it can be factored into how both numbers are read.
The same applies in reverse. Somebody whose A1C consistently reads lower than their GMI may be turning red blood cells over faster than average, which is one of the situations covered in our guide on factors affecting A1C results.
| GMI | Lab A1C | Gap | How to read it |
|---|---|---|---|
| 7.0% | 7.1% | 0.1 | Agreement, nothing to explain |
| 6.8% | 7.2% | 0.4 | Common and unremarkable |
| 6.6% | 7.8% | 1.2 | Worth discussing |
| 7.4% | 6.5% | 0.9 | Worth discussing |
Which one should you act on?
That decision belongs with your clinical team, and the honest answer is usually both, for different purposes. The GMI responds within a fortnight, which makes it the better feedback signal when something has just changed. The A1C is the measurement guidance is written around and the one that goes into your record.
What you should not do is treat a favourable GMI as a reason to dismiss an unfavourable A1C, or the reverse. The disagreement itself is a piece of information, and the useful move is to ask why it exists rather than to pick a winner.
GMI and estimated average glucose are related but not the same. eAG converts a measured A1C into glucose units. GMI converts measured glucose into an A1C-like percentage. They run in opposite directions. Our guide to estimated average glucose covers the other half of that pair.
Keeping both in your record
Recording the GMI alongside each laboratory result, with the wear percentage beside it, turns a scattered set of app screenshots into something readable at an appointment. If the gap is stable across several pairs, that stability is itself worth showing.
The history mode of the calculator keeps your laboratory results with their dates and notes, and prints them as one page. Our guide on building a trend chart covers how to assemble it, and time in range explains the other headline figure on a sensor report.
Conclusion: Glucose Management Indicator
GMI is a calculation from sensor glucose, not a measurement of glycated hemoglobin. It covers a fortnight rather than a quarter, assumes an average glycation rate, and depends on how much of the period the sensor was actually worn. Differences of a few tenths from a laboratory A1C are normal, a consistent gap is personal information worth knowing, and a large gap is a conversation rather than an error.
Keep your laboratory results dated and note the GMI beside each one so the pattern becomes visible.