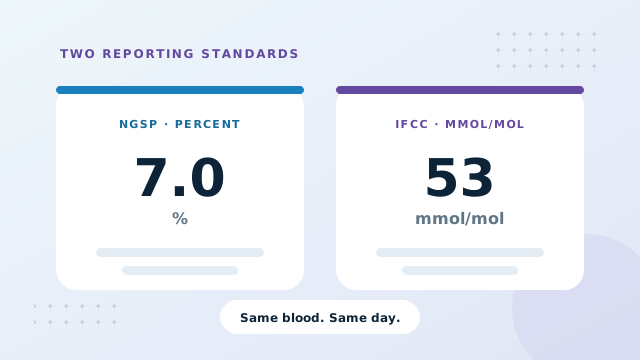
A1C In mmol/mol: The IFCC Unit Explained
If a report hands you a figure like 48 or 64 where you expected something around 6.5 or 8.0, nothing has gone wrong. You are reading the IFCC scale, which expresses the same measurement in millimoles per mole rather than as a percentage. This guide explains where the second scale came from and how to move between the two without confusion.
Why two scales exist
The familiar percentage comes from a standardisation programme built around a large American clinical trial. It was aligned to the methods that trial used, and because those results underpinned so much treatment guidance, the percentage became the number everyone quotes.
The difficulty is that a percentage aligned to a particular historical method is not a pure measurement. The International Federation of Clinical Chemistry developed a reference method that measures the glycated fraction directly and reports it in millimoles of glycated hemoglobin per mole of total hemoglobin. That is a unit with a definition rather than a lineage.
Several countries, including the United Kingdom and much of Europe, moved to reporting the IFCC figure. Others kept the percentage. Many laboratories now print both, which is why the same report can carry two very different looking numbers describing one result.
IFCC mmol/mol equals (percentage minus 2.15) multiplied by 10.929. Reverse it by dividing the mmol/mol figure by 10.929 and adding 2.15.
The full side by side table
Because both scales describe the same measurement, converting between them is exact rather than an estimate. The average glucose columns are then derived from the percentage in the usual way.
| Percent (NGSP) | mmol/mol (IFCC) | eAG mg/dL | eAG mmol/L | Band |
|---|---|---|---|---|
| 4.0% | 20 | 68 | 3.8 | Below 5.7% |
| 5.0% | 31 | 97 | 5.4 | Below 5.7% |
| 5.7% | 39 | 117 | 6.5 | Band opens |
| 6.0% | 42 | 126 | 7.0 | 5.7% to 6.4% |
| 6.4% | 46 | 137 | 7.6 | Band closes |
| 6.5% | 48 | 140 | 7.8 | Threshold |
| 7.0% | 53 | 154 | 8.6 | 6.5% and above |
| 7.5% | 58 | 169 | 9.4 | 6.5% and above |
| 8.0% | 64 | 183 | 10.2 | 6.5% and above |
| 9.0% | 75 | 212 | 11.8 | 6.5% and above |
| 10.0% | 86 | 240 | 13.4 | 6.5% and above |
| 12.0% | 108 | 298 | 16.5 | 6.5% and above |
The landmark figures to remember
Two numbers on that table do most of the work in everyday conversation, and both are worth knowing by heart if you read guidance from more than one country.
- 48 mmol/mol is 6.5 percent. The diagnostic threshold, and the figure quoted constantly in UK guidance.
- 53 mmol/mol is 7.0 percent. The most commonly referenced management target.
- 42 mmol/mol is 6.0 percent, and 39 mmol/mol is 5.7, the lower edge of the raised band.
Why the numbers look so much bigger
The scales differ in more than size. A percentage of total hemoglobin includes a baseline that the IFCC unit strips out, which is what the subtraction of 2.15 represents. After that, the multiplier of about eleven simply rescales the result into millimoles per mole. The practical consequence is that the IFCC scale spreads results out: one tenth of a percentage point becomes roughly one whole unit of mmol/mol.
That spread is useful. A change from 6.9 to 7.0 percent looks trivial written down. The same change from 52 to 53 mmol/mol also looks small, but a shift of 0.5 percentage points becomes five or six whole units, which reads as a more obvious movement.
Reading a report that shows both
Where both figures are printed, they are not two measurements. They are one measurement rendered twice, and if one looks out of step with the other, the printing is wrong rather than your biology.
| Printed percent | Printed mmol/mol | Do they agree? |
|---|---|---|
| 6.5% | 48 | Consistent |
| 7.2% | 55 | Consistent |
| 8.0% | 53 | Mismatch, query it |
Keeping a history across a change of unit
People who move countries, or whose laboratory switches reporting style, often end up with a record split across two scales. Charting that as a single line requires converting everything to one basis first.
The history mode of the calculator accepts each reading in whichever unit it arrived in and converts internally before plotting, so a run of older percentages and newer IFCC values still produces one continuous trend rather than two disconnected fragments. Our guide on building a trend chart covers how to assemble that record properly.
Do not attempt to compare an IFCC figure with a glucose average directly. They are different quantities entirely. Convert to a percentage first, then to an estimated average glucose, and the comparison becomes meaningful.
Conclusion: A1C In mmol/mol
The IFCC scale reports the same measurement as the percentage, expressed in millimoles of glycated hemoglobin per mole of total hemoglobin. Subtract 2.15 from the percentage and multiply by 10.929 to convert, or reverse those steps to come back. Learn 48 and 53 as landmarks and most published guidance becomes readable whichever country wrote it.
Enter any reading and every scale appears together, so a record split across two systems still charts as one line.